Note
Go to the end to download the full example code
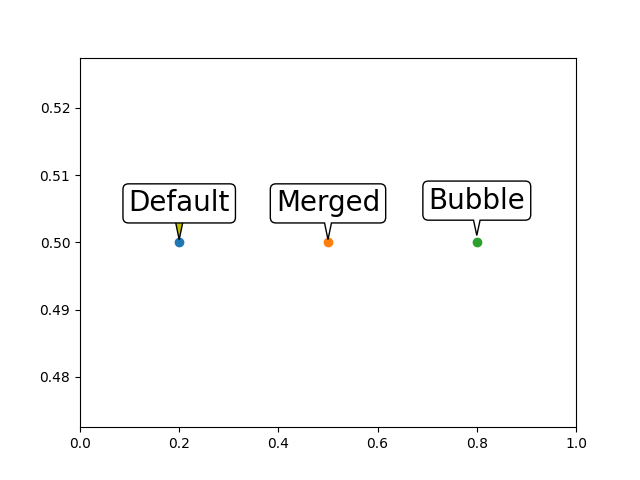
annotate_merged and annotate_bubble
from mpl_speech_bubble import annotate_merged, annotate_bubble

import matplotlib.pyplot as plt

if True:

    # t = annotate_bubble(ax, text, xy, xytext=(0, 30), xycoords='data',
    fig, ax = plt.subplots(num=1, clear=True)

    annotate_kwargs = dict(
        ha="center", va="bottom",
        size=20,
        bbox=dict(boxstyle="round, pad=0.2",
                  fc="w", ec="k"),
        arrowprops=dict(
            arrowstyle="wedge, tail_width=0.5",
            fc="y",
            patchA=None, # by default, annotate set patchA to the bbox.
        )
    )

    xy = (0.2, 0.5)
    ax.plot([xy[0]], [xy[1]], "o")

    # t = annotate_merged(ax,
    t = ax.annotate(
        text="Default",
        xy=xy, xycoords='data',
        xytext=(-0., .9), textcoords="offset fontsize",
        **annotate_kwargs
    )

    xy = (0.5, 0.5)
    ax.plot([xy[0]], [xy[1]], "o")

    t = annotate_merged(
        ax,
        text="Merged",
        xy=xy, xycoords='data',
        xytext=(-0., .9), textcoords="offset fontsize",
        **annotate_kwargs
    )

    xy = (0.8, 0.5)
    ax.plot([xy[0]], [xy[1]], "o")

    t = annotate_bubble(
        ax,
        text="Bubble",
        xy=xy, xycoords='data',
        loc="up", dist=1.,
        size=20,
    )

    ax.set_xlim(0, 1)

    plt.show()
Total running time of the script: (0 minutes 0.134 seconds)